Augmenting Data For Streamlined, Affordable Water Monitoring
When we first started the TeleAgriCulture platform, during our inaugural think tank at Cultivamos Cultura in Portugal in early 2019, one of the main use cases (as it still is today) is water oriented solutions to growing food. Back then we were spending around 5 hours a week doing rigorous chemical testing of the water for dissolved nutrients, toxins, pH etc. but also for salinity as the use case where we were in São Luís/Algarve was a problem area where the mild brack water was becoming increasingly salinated due to an abandoned (massive!( aquaculture farm shutting and the sea water creeping up further into the river.
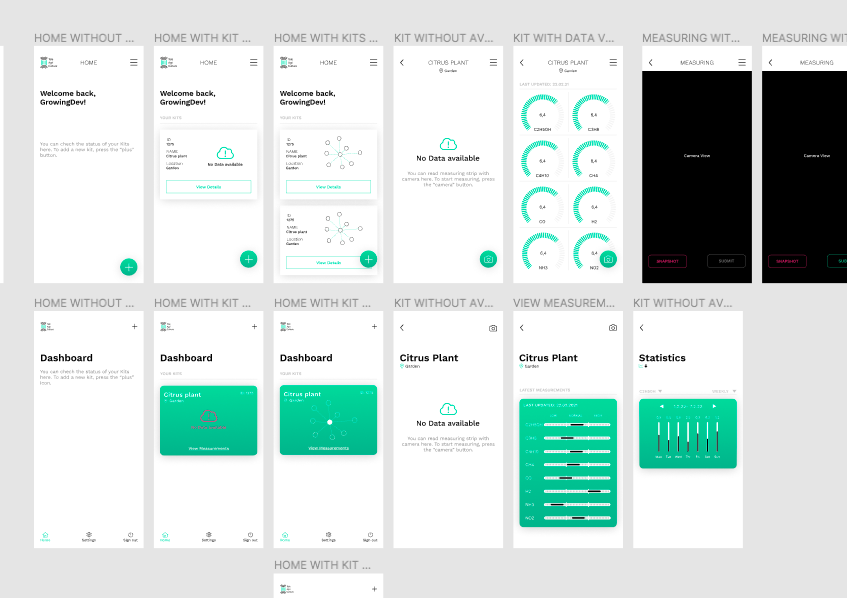
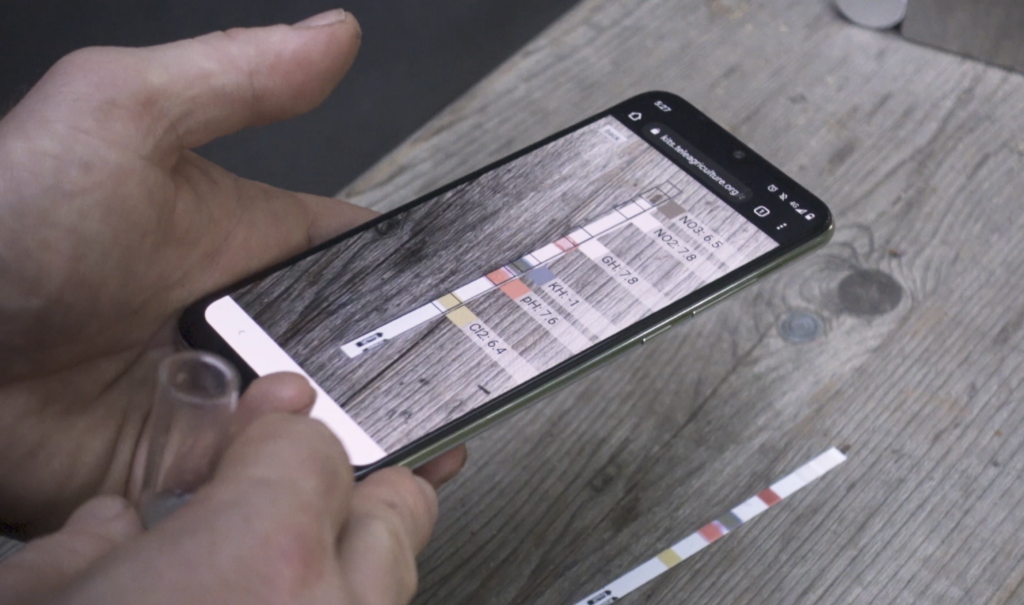
The problem after returning to Austria where the water is ridiculously clean and usually coming directly from alpen springs, was that that level of testing was unnecessary, butit still had to be monitored, as in some case such as with aquaponics systems, a simple method was needed for spot checks that then either can be over in mere seconds if the system is healthy, or otherwise then tested more thoroughly. The isse us that all accurate water sensors are either expensive, or need regular calibration, or in a lot of case have a lifespan on only around 6 months. To try and address this we started using simple water strip tests, that cost about ¢28 per test. The problem is that this created a poor use case where if you wanted to archive the test values (one of the main points of the data platform) that you had a whole process to enter them and upload to the server. To solve this we made a very simple augmented reality feature for our kit users where you dip the strip, wait 3-0 seconds and then, through our app, scan the strip and press upload, saving a lot of time.
This then got us thinking about what else we can augment (afterall Julian’s PhD is on Augmentation Aesthetics and Bio-Digital Systems) so since then we have been working on a number of experiments in augmentation, both in the ways we enter date, but also the ways we interface it, with the aim of optimising system monitoring in terms of time and simplicity, while also maintaining regular data entry, monitoring and maintenance.
Simple new features such as push notifications set to your chosen parameters that you need, replacing numerical data with graphical elements such as histograms, comparative visual mapping and color coding system health. These innovations speed up the boring bits so you can focus on the cooler creative parts to your project.